259f1e4b4ce6e566524a58454fac7bcc8a7de9db
DataV
What is DataV?
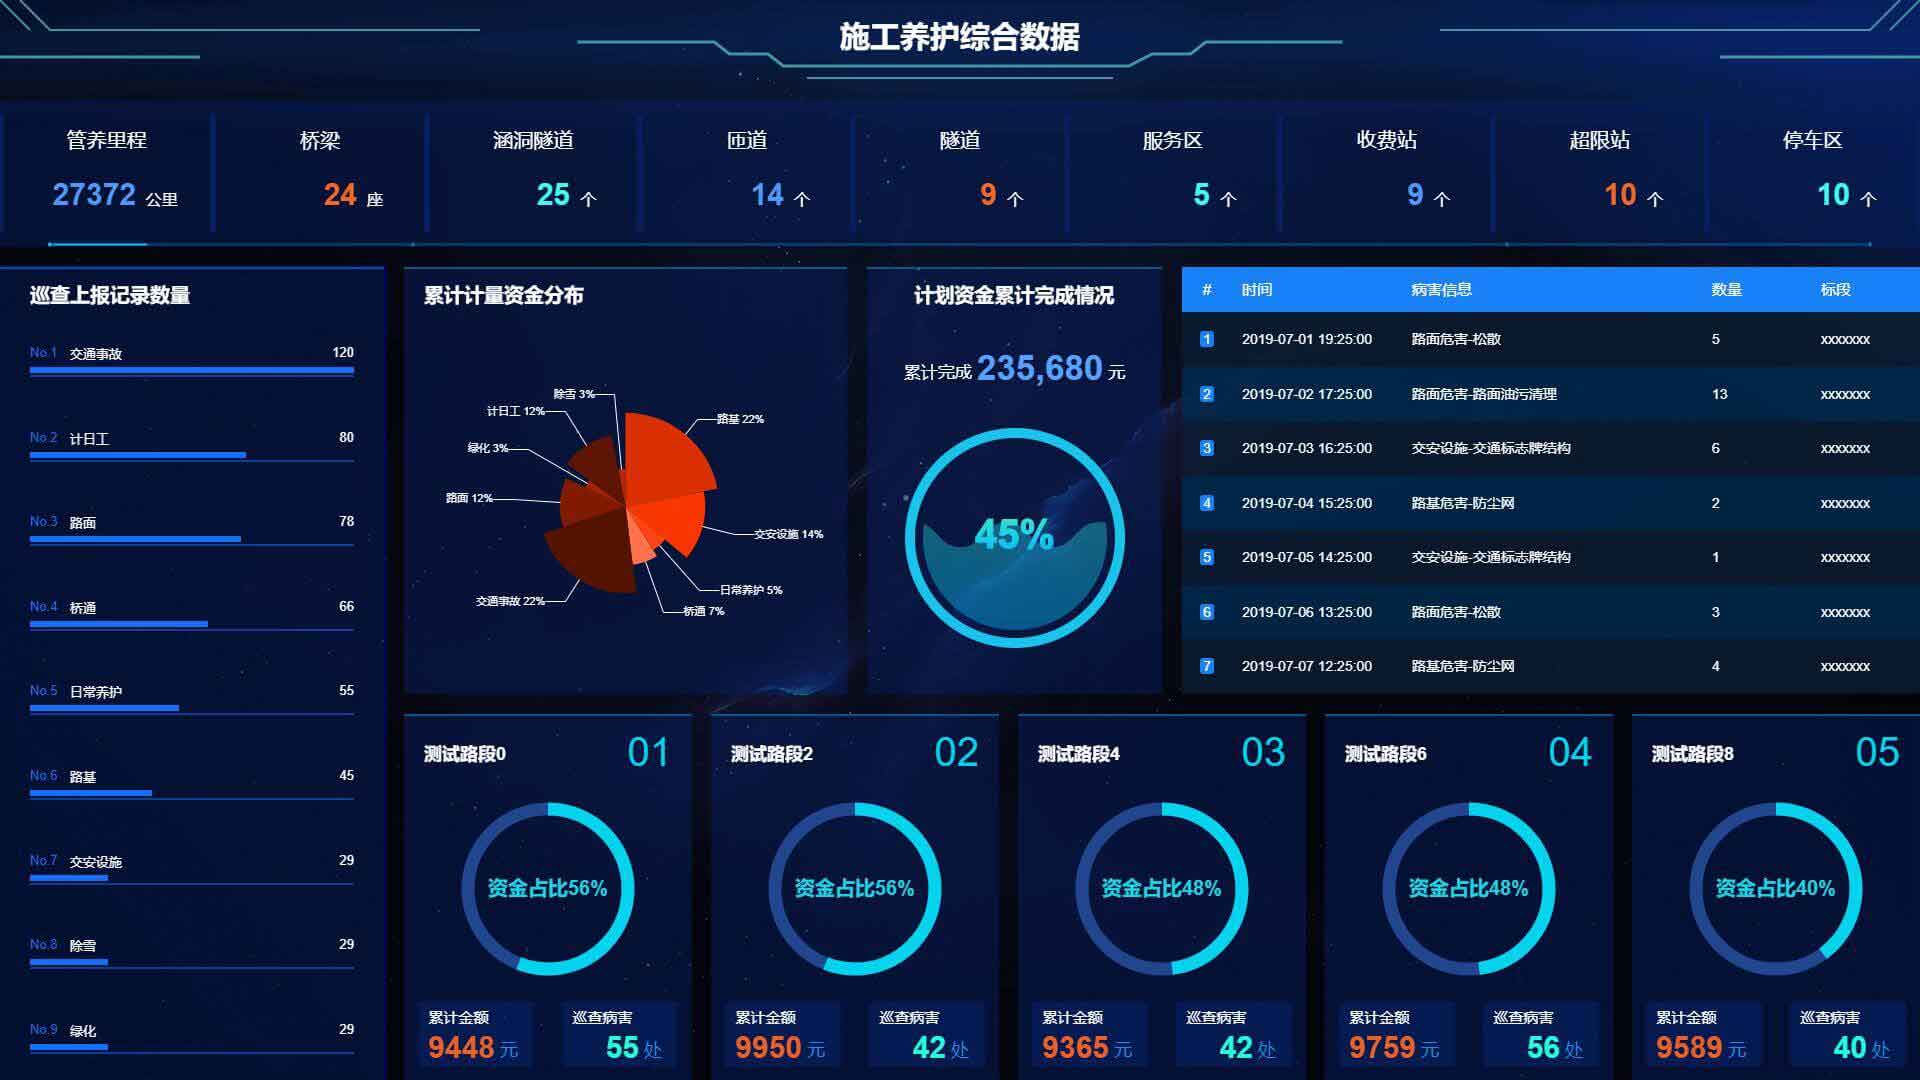
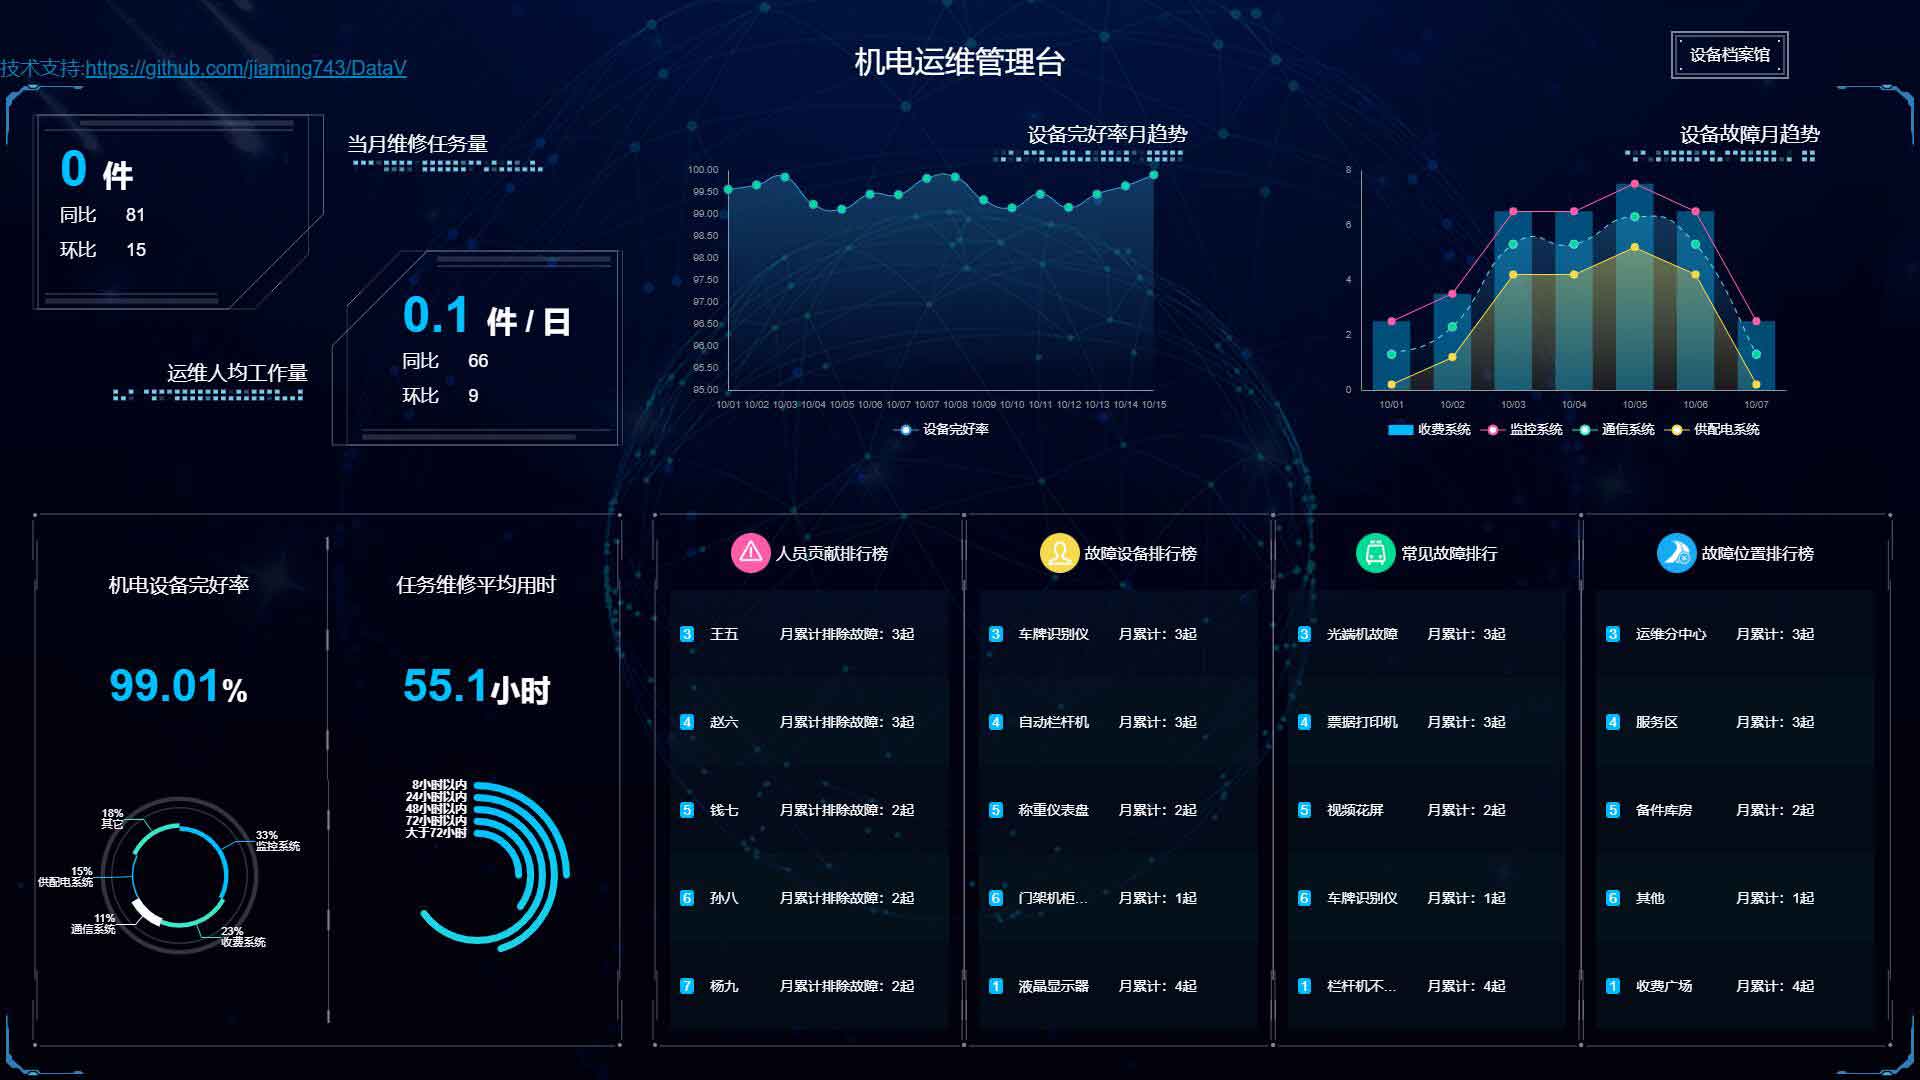
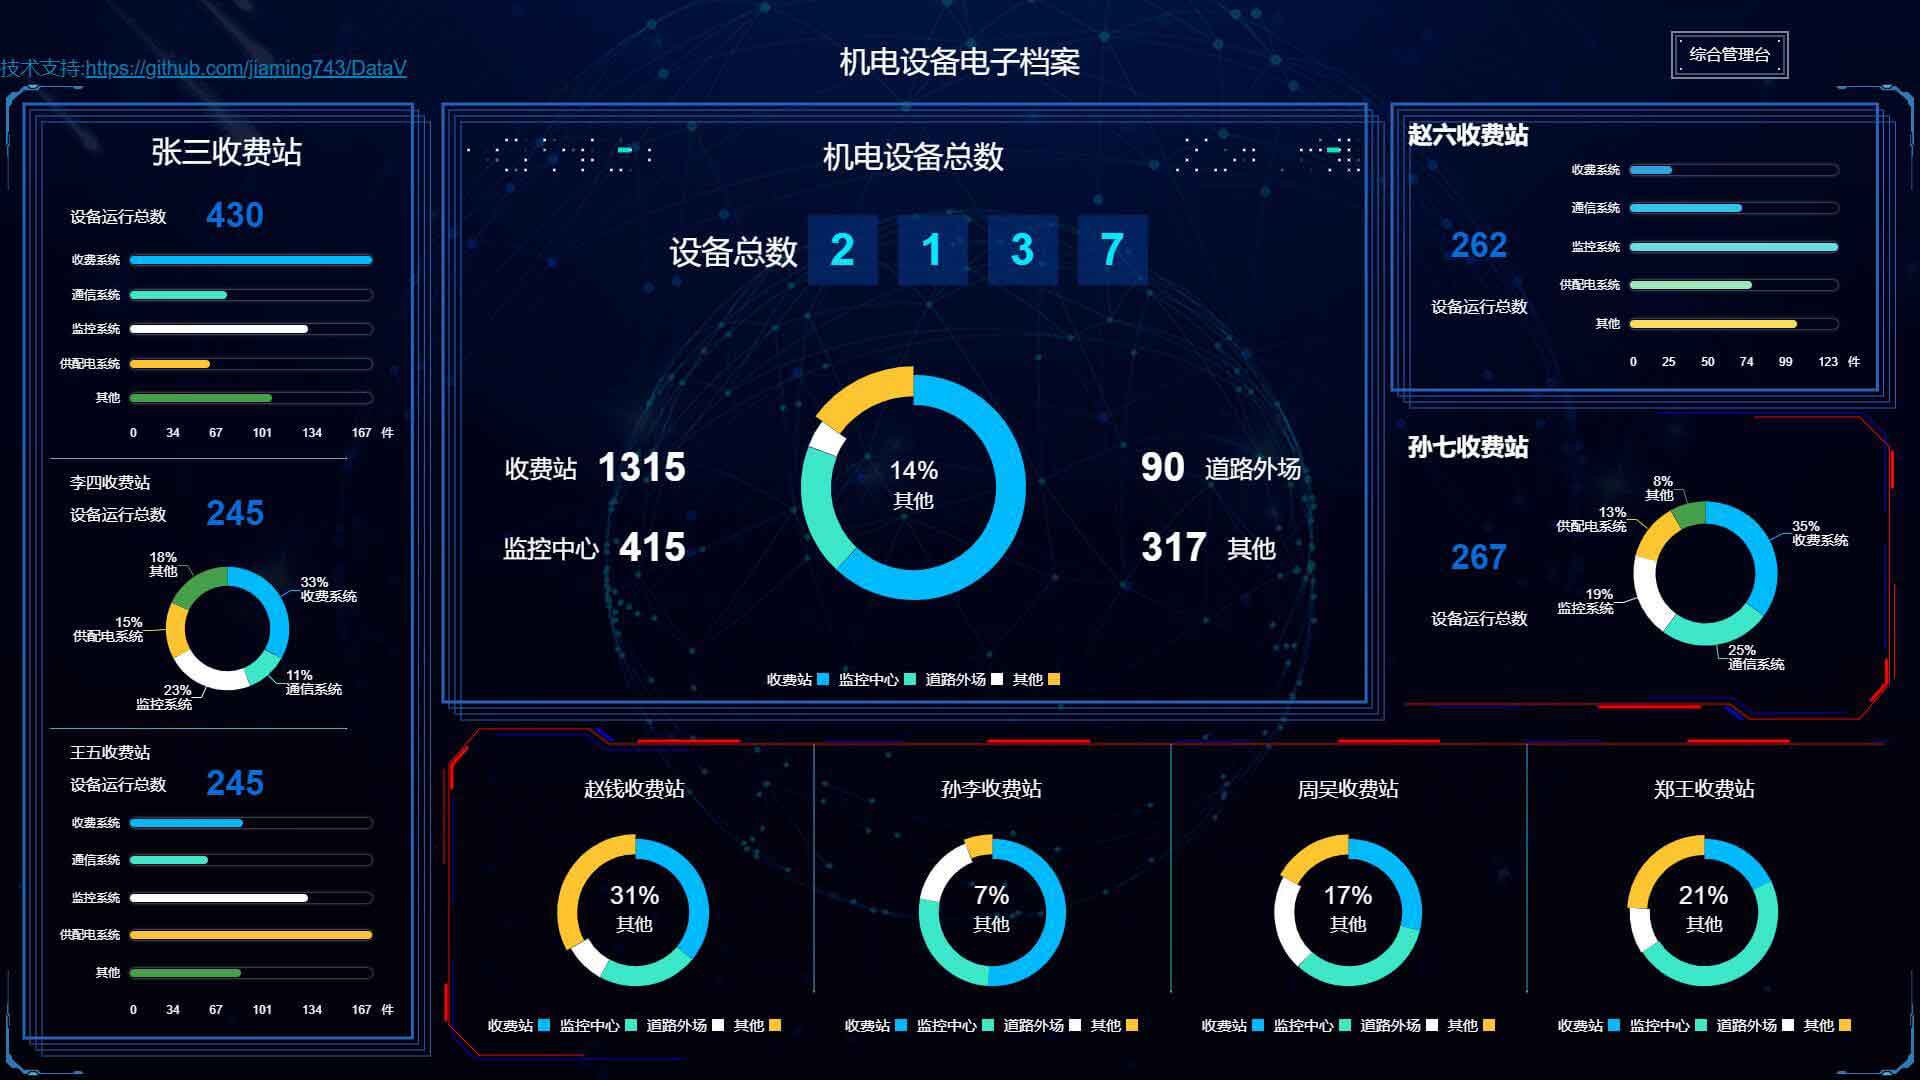
- DataV is a data visualization components library based on Vue.
- Provide cool SVG borders and decorations.
- Provide common charts such as line chart, etc..
- flying line chart, carousel table and etc.
Install with npm
$ npm install @jiaminghi/data-view
use
import Vue from 'vue'
import DataV from '@jiaminghi/data-view'

Vue.use(DataV)

// Introduced on demand
import { borderBox1 } from '@jiaminghi/data-view'
Vue.use(borderBox1)
Detailed documents and examples can be viewed on the HomePage.
React version
The reaction version is already under development, so stay tuned
Questionnaire
React version of the component library and feedbackQuestionnaire
TODO
- flylineChartAdd multi-center point and reverse fly line function.
- Add color and other necessary configuration to the borderBox and decoration to enhance configurability and flexibility.
Acknowledgement
The development of the component library is based on personal learning and interest. Due to technical level and experience limitations, there are still many imperfections in the components. If there are errors, you can submit issue in time or add feedback groups for feedback. Welcome to provide corrections and suggestions. Thank you for your support.
Feedback
Demo
The Demo page uses the full-screen component, please view it after F11 full screen.
Description
Languages
Vue
86.5%
JavaScript
9.5%
CSS
3.8%
HTML
0.2%


